
Project Overview
This project is part of the CSCI323 - Modern Artificial Intelligence module at SIM-UOW. It focuses on predicting resale prices of HDB flats in Singapore using supervised machine learning techniques. Leveraging over 200,000 structured HDB resale records from January 2017 to May 2025, we analyzed features such as town, flat type, floor area, lease details, and transaction dates to uncover pricing trends and key influencing factors.
We implemented and evaluated four models — XGBoost, Random Forest, Multilayer Perceptron (MLP), and Skforecast. Among them, XGBoost achieved the most accurate results, especially after applying feature engineering with external economic and time-based data. This project highlights real-world challenges such as data imbalance across towns and the absence of geospatial features. Our findings suggest future improvements like ensemble learning and spatial data integration to enhance prediction accuracy in underrepresented regions.
Objective
The goal is to create predictive models that provide insights into resale pricing trends and help buyers, sellers, platforms, and policymakers make better decisions.
Models & Tools Used
- Machine Learning Models: Random Forest, XGBoost, MLP (Neural Network)
- Libraries: scikit-learn, Pandas, NumPy, TensorFlow
- Platform: Google Colab
- Evaluation Metrics: MAE, RMSE (by town and flat type)
- Visualization: Matplotlib, Seaborn
Data Sources
- HDB Resale Prices (Jan 2017–May 2025) – data.gov.sg
- HDB Resale Price Index – data.gov.sg
- URA Private Property Index – data.gov.sg
- Consumer Price Index – World Bank
Preprocessing Overview
To prepare over 200,000 HDB resale records for modeling, we applied several preprocessing steps:
- Datetime Parsing: Converted 'month' to datetime format for time-series analysis.
- Feature Engineering: Extracted year and month, calculated remaining lease, and encoded categorical features like flat type and town.
- Filtering: Removed outliers and dropped rare flat types with insufficient data.
- Normalization: Applied scaling to numerical features like floor area for MLP input.
- Train/Test Split: Used 2017–2024 as training data and Jan–May 2025 as the test period.
These steps helped improve model accuracy and ensured fair comparison across XGBoost, Random Forest, and MLP models.
Model Evaluation Summary
Below are the model performances (with and without feature engineering):
| Model | Feature Eng | R² | RMSE | MAE |
|---|---|---|---|---|
| XGBoost | ✔ | 0.9176 | 57286.15 | 42405.33 |
| Random Forest | ✔ | 0.8546 | 75095.03 | 55121.53 |
| MLP | ✔ | 0.8683 | 72411.03 | 51694.62 |
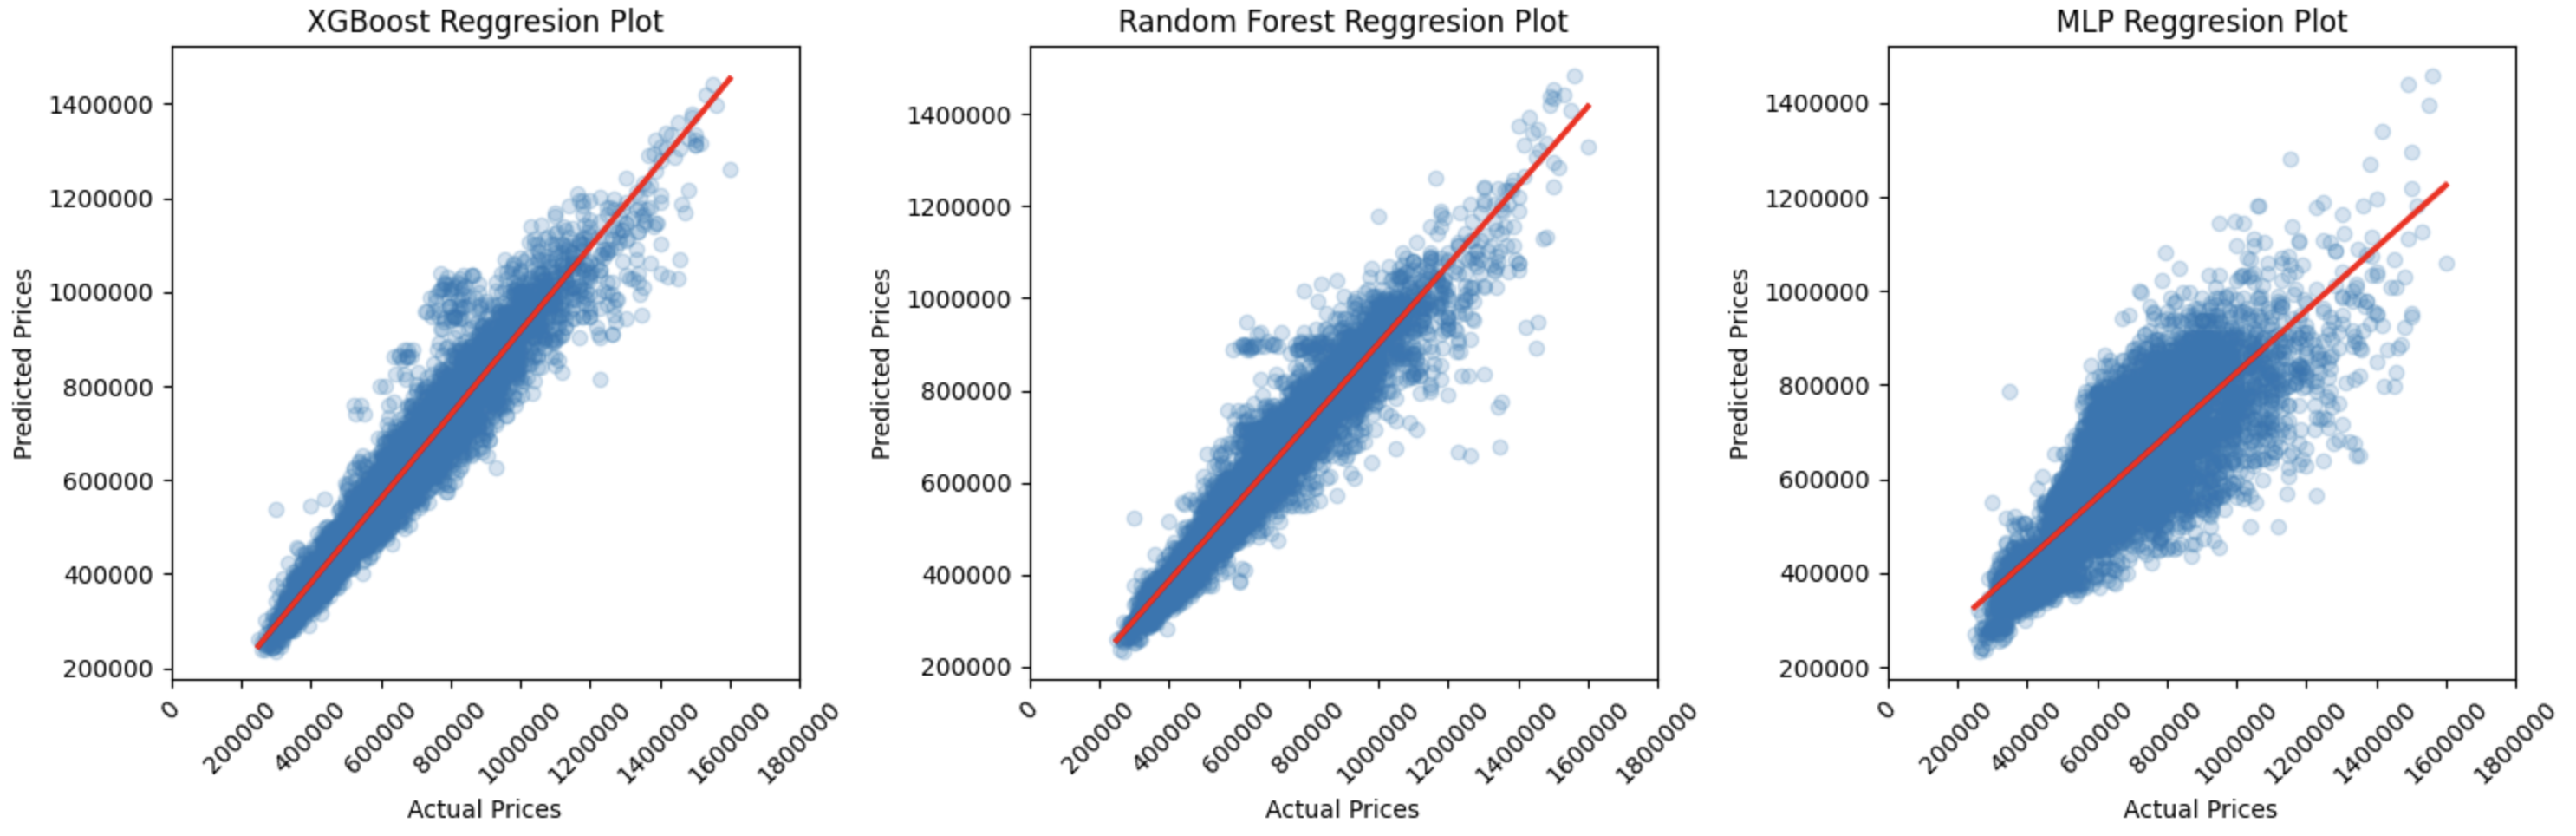
Result Visualizations
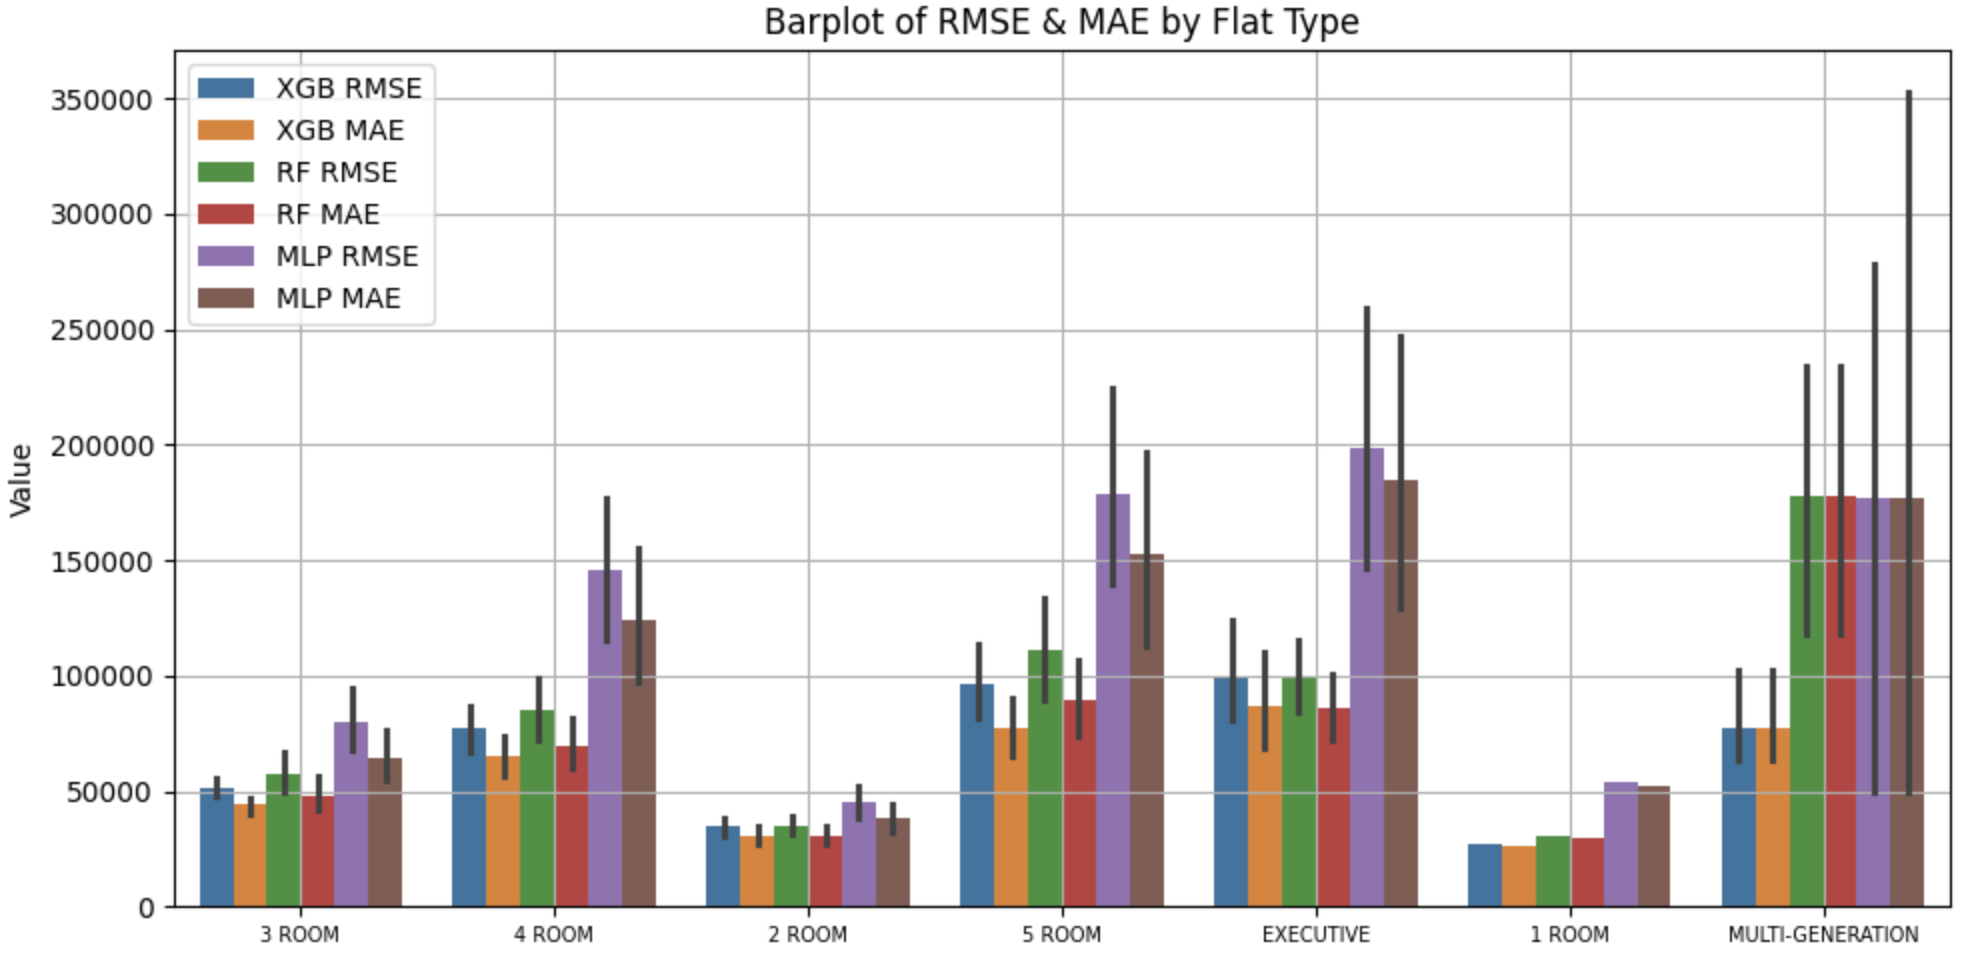
RMSE & MAE by Flat Type
This bar chart compares RMSE and MAE across flat types using XGBoost, Random Forest, and MLP models. It shows that XGBoost generally provides lower errors, especially in 3-Room to 5-Room flats.
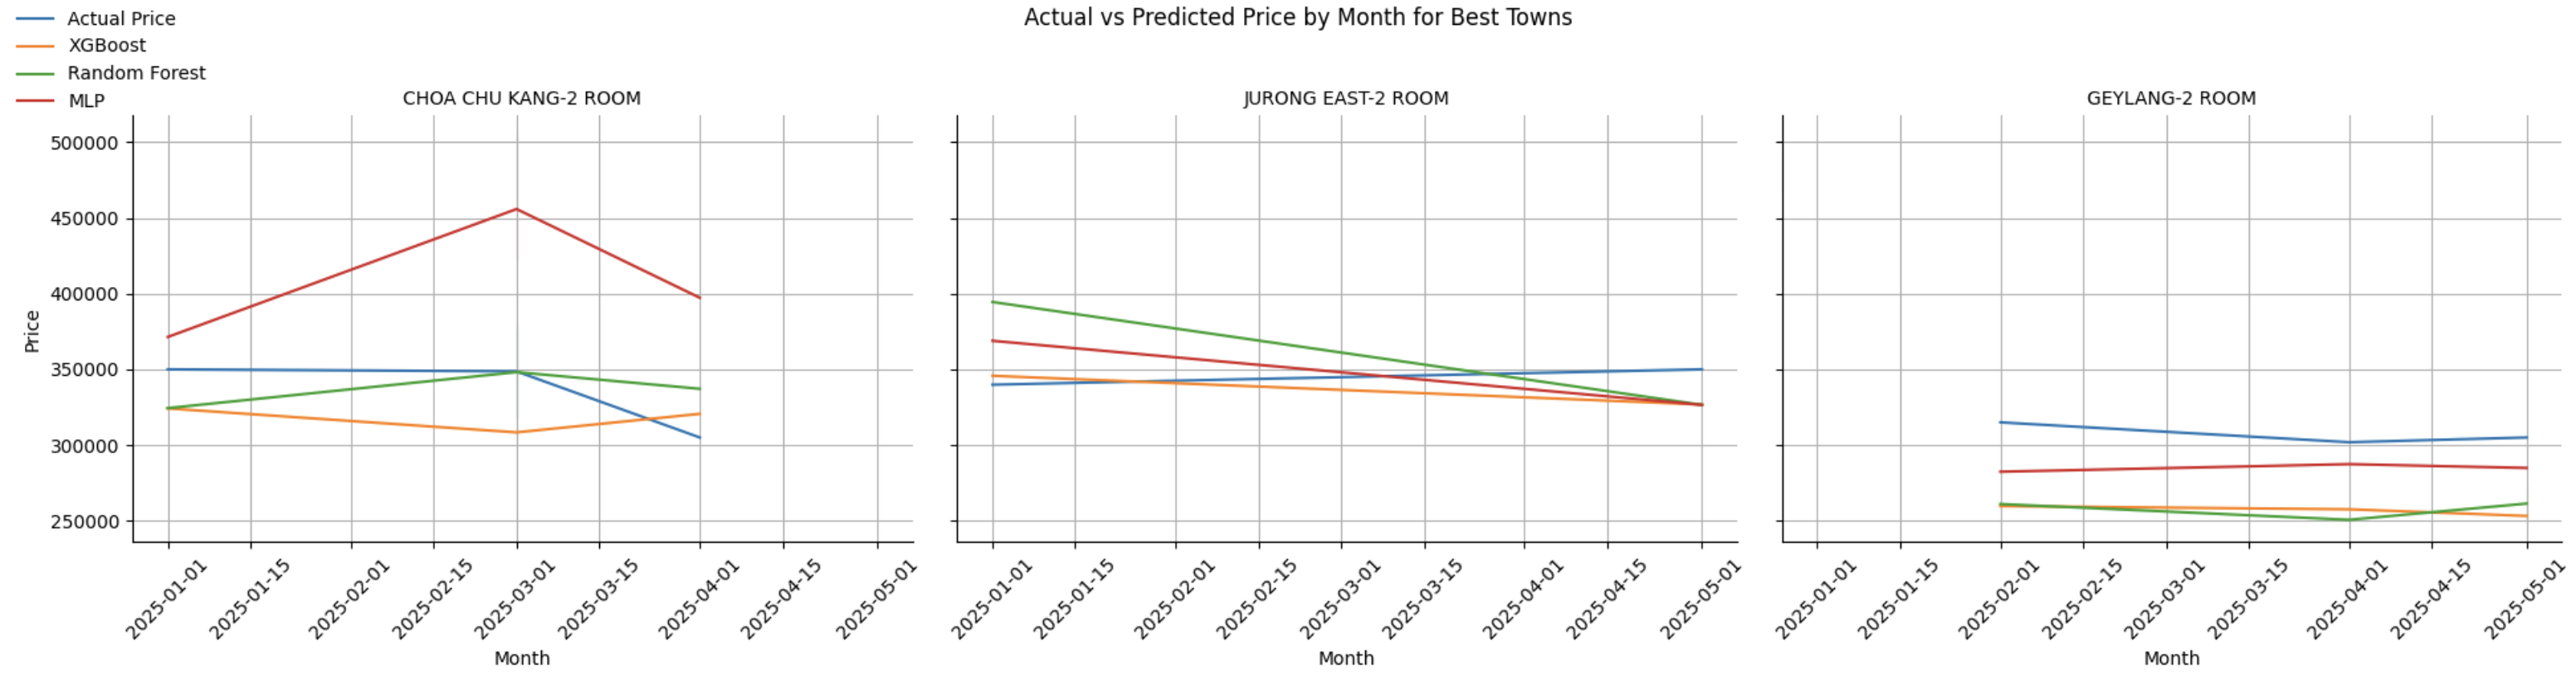
Actual vs Predicted Price – Best Towns
This line plot shows the prediction results for the best-performing towns (e.g., Choa Chu Kang, Jurong East, Geylang). The model predictions are close to actual prices, especially for 2-Room flats.
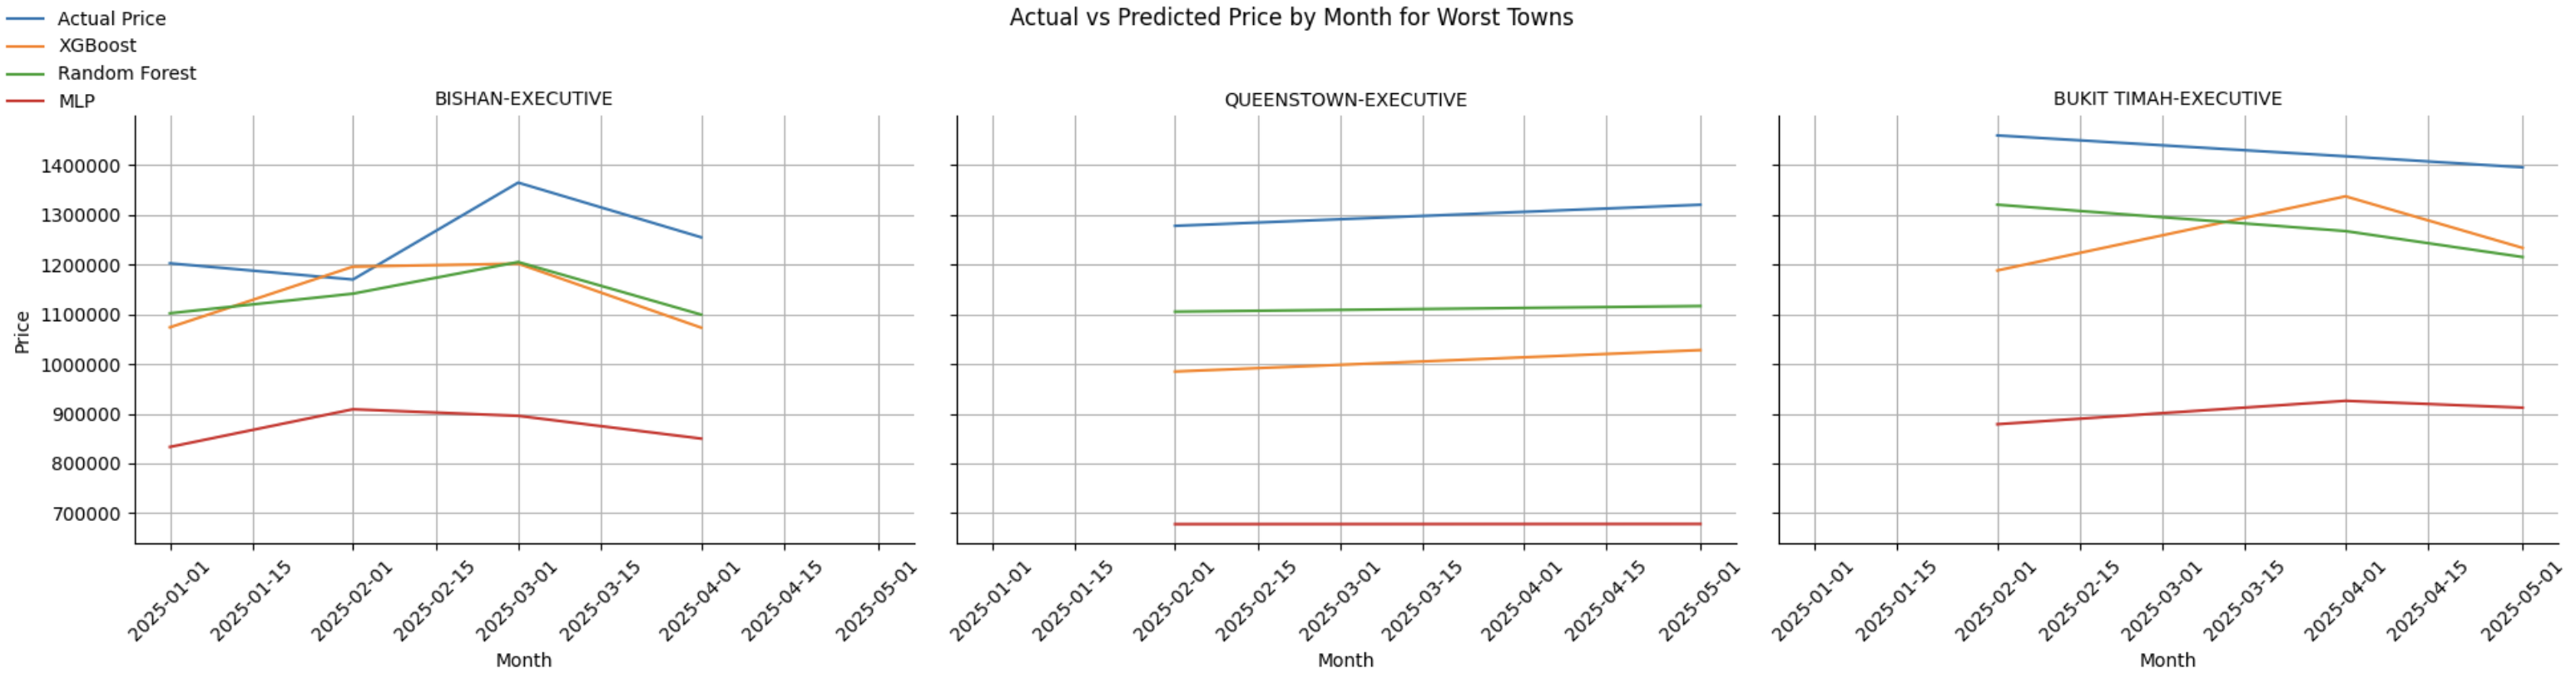
Actual vs Predicted Price – Worst Towns
This plot illustrates prediction challenges in higher-priced areas like Bukit Timah and Queenstown. The gap between actual and predicted values highlights model limitations in luxury or low-volume regions.
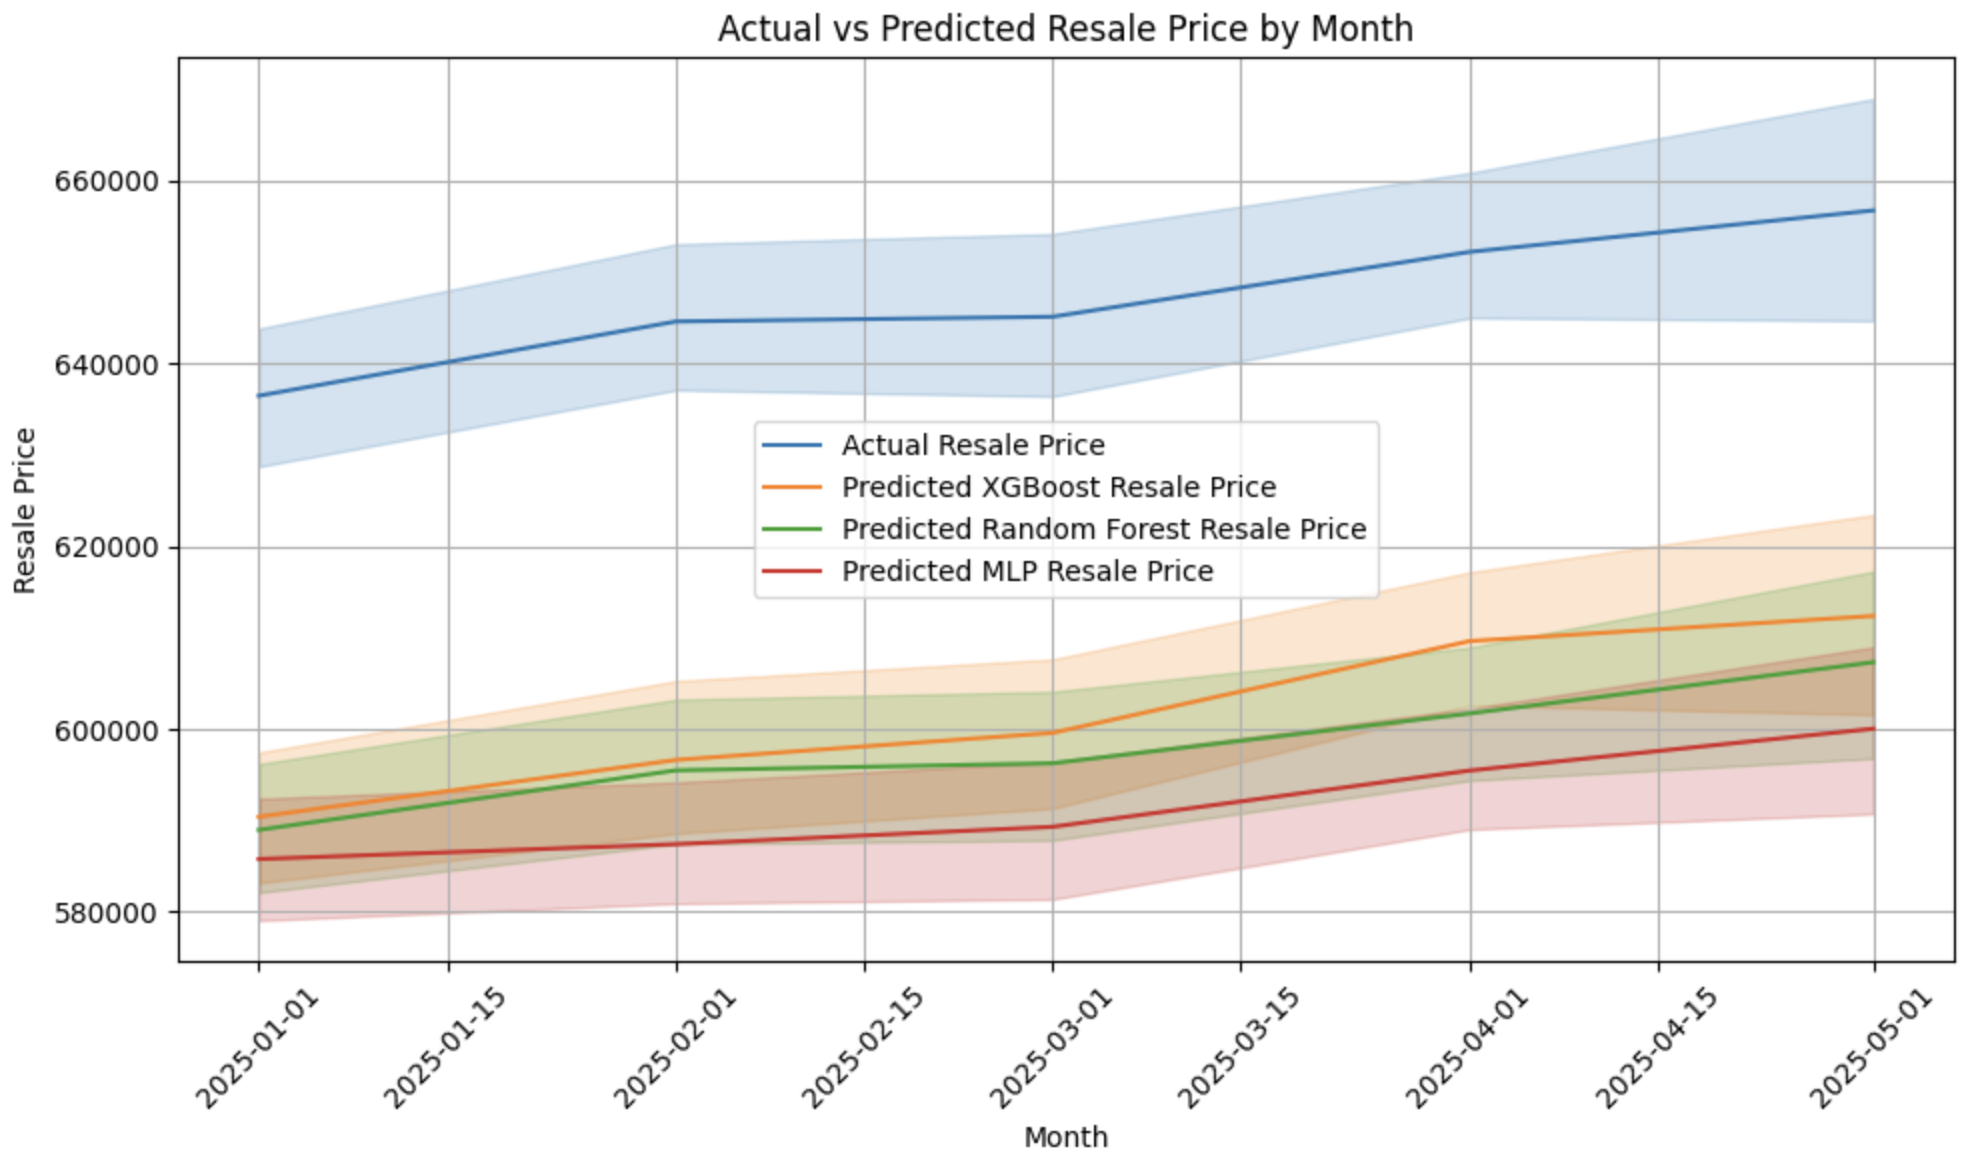
Overall Resale Price Trend (Jan–May 2025)
This graph shows how resale prices evolve over time and how well the models capture these changes. XGBoost maintains the closest fit to actual price trends across months.
Regression Fit Comparison
These scatter plots compare predicted vs actual resale prices. XGBoost again shows the tightest clustering along the ideal regression line.
More Details & Source Code
For complete code, models, and data processing steps, check the full project on GitHub or read our final report: